File:HpAtLeastOdds.png: Difference between revisions
Jump to navigation
Jump to search
A graph showing each race's probability of leveling a character with a base of "at least" x hit points. These are all simply shifted graphs of the baseline result calculating the sum of 49 repeated probability tests of a number in the range 12 to 17 incl |
(No difference)
|
Latest revision as of 03:38, 17 June 2019
A graph showing each race's probability of leveling a character with a base of "at least" x hit points. These are all simply shifted graphs of the baseline result calculating the sum of 49 repeated probability tests of a number in the range 12 to 17 inclusive. The initial shift represents the character's racial base.
File history
Click on a date/time to view the file as it appeared at that time.
| Date/Time | Thumbnail | Dimensions | User | Comment | |
|---|---|---|---|---|---|
| current | 03:38, 17 June 2019 | 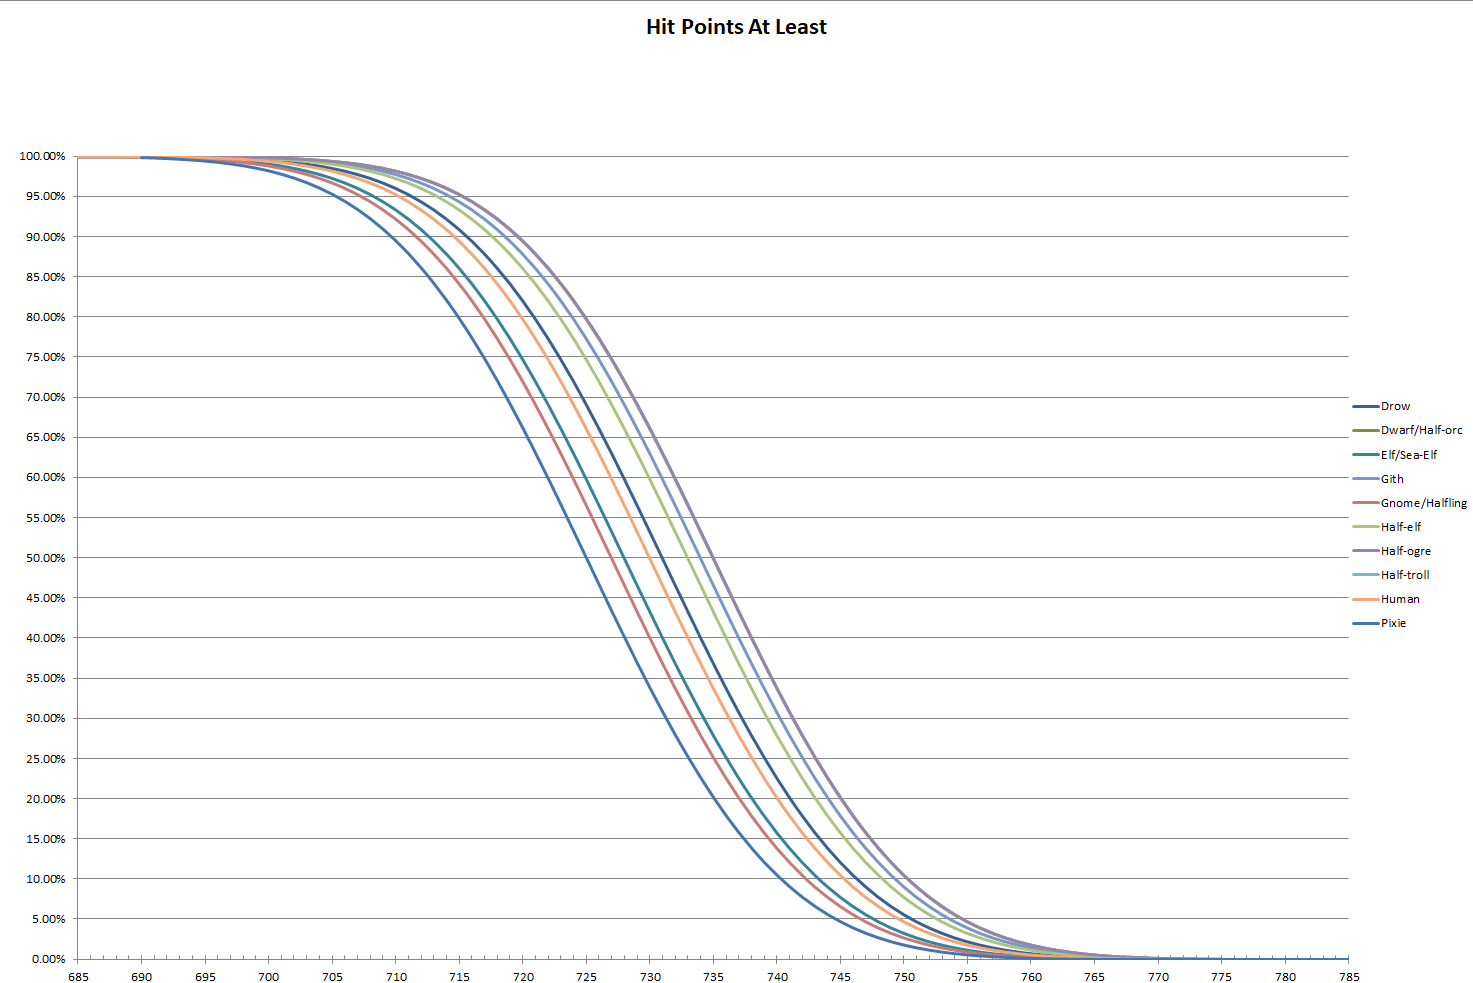 | 1,473 × 983 (120 KB) | Tharius (talk | contribs) | A graph showing each race's probability of leveling a character with a base of "at least" x hit points. These are all simply shifted graphs of the baseline result calculating the sum of 49 repeated probability tests of a number in the range 12 to 17 incl |
You cannot overwrite this file.
File usage
The following page uses this file: